Baler, available as a stand-alone or Ovis-integrated package, is a collection of programs aiming to aid system log analysis task by summarizing the input log messages into informative, human-friendly wild-card patterns. Baler also offer event occurrence visualization and association rule mining among message pattern occurrences for root-cause analysis and event prediction tasks.
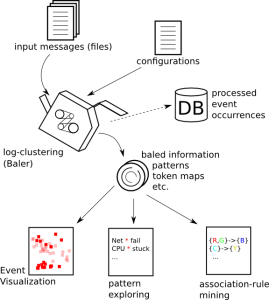
The overall process of Baler is illustrated in Figure 1. Before exploring the patterns, users have to first run log-clustering2 (see Log-Clustering), which takes a configuration file and multiple log files as its inputs. The result from log-clustering2 is a directory containing files that store necessary information, such as token mapping, pattern description and database connection (needed for Event Visualization). Users can see this output directory as a packed (or baled) information. meta-clustering is also invoked by log-clustering to further cluster textually similar patterns together. The occurrence information (time, location and pattern_id) will be stored in the database for Event Visualization. Once new log files are available, log-clustering2 can update the existing results for data consistency.
Once the log messages have been processed, users can use either baron or baler-gui to explore the results. Please see Pattern Exploring and Events & Event Visualization for more details. Event occurrence association can be mined using Association-Rule Mining functionality in the GUI. The association rule can help revealing causes of the bad events or help predicting future bad events. Please see Association-Rule Mining for more information.
Building and Setting Up Baler
Baler comes in two variations: stand-alone and ovis-integrated. For stand-alone variation, please see Stand-alone. Otherwise, please see Ovis-integrated.
Stand-alone
Please follow the following instruction to build the stand-alone Baler:
# Obtain Baler from the git repository

git clone git-ovis@hekili.ca.sandia.gov:baler.git /path/to/baler_dir
cd /path/to/baler_dir

# Edit common.mk file and change BUILD_DIR and other variables as necessary
# By default, BUILD_DIR is './build', i.e. BUILD_DIR = /path/to/baler_dir/build
# Then, run make

make -j8

# Then, we need to point $PATH to /path/to/baler_dir/build/bin
# so that the baler binaries can access the script files easily

echo 'export PATH=$PATH:/path/to/baler_dir/build/bin' >> $HOME/.bashrc

# *** INITIAL DATABASE FOR INITIAL SETUP ONLY ***

mysql BALER_DB < /path/to/baler_dir/src/log-clustering/sql/baler.sql
Stand-alone for Fedora 14
For Fedora 14, I did the following and can get Baler to run successfully:
# First, install the prerequisites
yum install git-all # I prefer to install all of the git .. but if you think this is unnecessary, I belive only git package would do
yum install mysql mysql-server mysql-devel
yum install qt-devel qt-mysql
yum install boost-devel boost-iostreams boost-program-options
yum install perl-Algorithm-Diff

# Then, obtain Baler from the git repository

git clone git-ovis@hekili.ca.sandia.gov:baler.git /path/to/baler_dir
cd /path/to/baler_dir

# Edit common.mk file and change BUILD_DIR and other variables as necessary
# For Fedora 14, the variables in common.mk should be changed as follows:
#
# QT_INCLUDE_DIR = /usr/include
# QT_LIB_DIR = /usr/lib64
#
# By default, BUILD_DIR is './build', i.e. BUILD_DIR = /path/to/baler_dir/build
# Then, run make

make -j8

# Then, we need to point $PATH to /path/to/baler_dir/build/bin
# so that the baler binaries can access the script files easily

echo 'export PATH=$PATH:/path/to/baler_dir/build/bin' >> $HOME/.bashrc

# *** INITIAL DATABASE FOR INITIAL SETUP ONLY ***
# Usually, BALER_DB is the same as OVIS_DB

mysql BALER_DB < /path/to/baler_dir/src/log-clustering/sql/baler.sql
Ovis-integrated
Currently, there is no repository for ovis-baler integration yet. The link to the package is provided in the following instruction:
# Assume that /path/to/ovis-baler is the directory that contain Ovis+Baler codes
# This package is made from a git-cloned directory.
# So, we can do git submodule init & update with it.

# The integrated version can be obtained here:
wget http://dl.dropbox.com/s/v219shpokkr32ev/ovis-baler-1.tgz?dl=1 -O /path/to/ovis-baler.tgz

cd /path/to && tar xzf ovis-baler.tgz

cd /path/to/ovis-baler
git submodule init
git submodule update --recursive

# For those who does not have 'git submodule update --recursive' working properly (I have this problem :P)
# you will have to manually update the module util/libevent in util/ldms.
cd /path/to/ovis-baler/util/ldms
git submodule init && git submodule update
cd /path/to/ovis-baler/

# Then, make a build directory

mkdir -p /path/to/build_dir

# Change directory to the buld directory and do the ccmake thing

cd /path/to/build_dir
ccmake /path/to/ovis-baler

# In the Curses GUI (ccmake), press 'c' to automatically configure the build,
# change paths/variables as appropriated, and keep pressing 'c'.
# If errors occur, correct them (e.g. perl Algorithm::Diff not found --> install it)
# and reconfigure (pressing 'c') again ..
# Once there is not error, keep pressing 'c' until the generate option (g) appear.
# Then, press 'g' to generate the Makefile and other stuffs

# Then, run the GNU Make

make -j8

# Once the build is done, setup the path

echo 'export PATH=$PATH:/path/to/build_dir/bin' >> $HOME/.bashrc

# For INITIAL setup, do the Baler's database initialization in addition to Ovis's.

mysql OVIS_DATABASE < /path/to/baler-ovis/log-clustering/sql/baler.sql
Log-Clustering
log-clustering2 is the command to perform log message clustering. General usage of log-clustering2 is as follows:
log-clustering2 [OPTIONS] INPUT_FILE1 INPUT_FILE2 ...

# For example:
log-clustering2 --config config_file /var/log/kern.log /var/log/syslog

# Shell wildcard expansion can also be useful in some cases, such as
# when the cluster logs are stored in each node's directory
log-clustering2 --config config_file /path/to/cluster_log/*/log
The options can be set either by command-line options or in the configuration file (but don’t forget to tell the program that you have a configuration file by specifying ‘–config CONFIG_FILE’ option).
The full list of options and their descriptions are as follows:
–help
Print help message.
–config
ARG Telling the program that ARG is the configuration file
-p,–project-dir ARG
Set ARG as project directory (output directory). The processed information (except event occurrence information) will be stored in this directory.
–log-format
ARG The format of input log files. Now support syslog, bgl cray, rsyslog for regular Linux syslog format, Blue Gene/L log format, Cray log format, and Cray’s rsyslog used in LLM respectively.
-e,–eng-list ARG
ARG is a path to an English word list file (single-word per line). English words are used to heuristically determine the constant part of the message pattern.
-s,–svc-list ARG
ARG is a path to a service list file (single-word per line). Similar to English words, service names are used to determine the constant part of the messgae pattern.
–host-list ARG
Host list file (ARG) is a file that contain hostnames, one each line, preferrably sorted as the line number will be used as internal host ID. If this file is not specified, the internal host ID numbers are not guaranteed to be in order (e.g. node10 may be mapped to 1 and node1 may be mapped to 7) as the host-to-ID mapping is generated on-the-fly (hence first come, first serve).
-y,–year ARG
For syslog format, users need to specify the year ARG because the timestamp part of the log format is MMM D hh:mm:ss.
–db-server ARG
The address (hostname or IP address) of the database server.
–db-schema ARG
The schema for log-clustering2 to work with. It is recommended to use the same schema as Ovis.
–db-username ARG
The username for the log-clustering2 to use when inserting event occurrence data into the database.
–db-password ARG
The database password. Preferrably, the password should not be explicitly stated in the command line or in the configuration file. So, it is recommended to setup the database user on database server so that it does not need a password to connect.
–db-type ARG
The type of the database. Since log-clustering2 uses QtSql library to connect to the database, the available database types are: mysql, psql, db2, ibase, oci, odbc, sqlite, sqlite2 and tds.
–meta-count ARG
Floating-point ARG >e; 0 is the threshold of edit distance to determine if a pair of patterns are similar. With this criteria, a pair of patterns are similar when (their edit distance) < ARG. For more information, please see Meta-Clustering. (NOTE: Considering remove meta-count option)
–meta-ratio ARG
Floating-point ARG ∈ [0,1] is the threshold of difference ratio, determining whether a pair of patterns are similar. A pair of patterns are similar if (their edit distance)/(max length between the two) < ARG. For more information, please see Meta-Clustering. (FIXME: If meta-ratio is not specified, its default value is 0. Thus, each pattern will end up being its own meta-cluster.)
–meta-looseness ARG
Floating-point ARG ∈ [0,1] that control ‘looseness’ of the resulting meta-clusters. A looseness of a meta-cluster is defined to be the average pairwise diff-ratio among patterns in the meta-cluster. Hence, the more looseness, the more different patterns in the meta-cluster. To solve loose-cluster problem, meta-clustering script (invoked by log-clustering2) will sub-cluster any loose meta-clusters (also see –meta-speed). A meta cluster is determined to be ‘loose’ if its looseness > ARG. Default: 0.25
–meta-speed ARG
Speed, or rather a sub-clustering speed, is a floating-point value > 1. It indicates how fast the difference ration decrease in the sub-clustering process. In other words, new_meta_ratio = old_meta_ratio/ARG. Default: 1.20;
–meta-logic (AND|OR)
(Deprecated) The meta-clustering logic between meta-ratio and meta-count to determine pattern similarity. For example, if the meta-count=5, meta-ratio=0.2 and meta-logic=AND, two patterns are similar when their meta-count < 5 AND meta-ratio < 0.2. Default: OR
–trivial-meta (1|0)
If this is set to 1, meta-clustering script will not be called, but a trivial meta-cluster (each pattern has its own meta-cluster) will be produced instead. Default: 0
–stdin (1|0)
If this is set to 1, log-clustering2 will take messages from STDIN instead of input files. Default: 0
–follow-precede (1|0)
If set to 1, log-clustering2 will produce information regarding follow/precede relations among patterns. Default 1
Meta-Clustering
Users should not manually call meta-clustering script, and should let log-clustering2 and GUI module handling the calling. However, it is necessary to understand how it works in the background.
log-clustering2’s purpose is to quickly derive a pattern from a given message, heuristically considering English words and Service names as constant terms of the pattern, and considering others as varying terms (which are represented by *). As such, there might be some patterns mistakenly took varying terms for constant terms as they appear English. For example, the message User logged in: root will have User logged in: root as its pattern instead of User logged in: *, while the same message for other users that does not have their names in the English word list will correctly result in User logged in: *. Thus, we will end up having both User logged in: * and User logged in: root. (This is called over-specific clustering problem).
Meta-clustering tends to this problem by evaluating pair-wise pattern similarity and group them based on their similarity relationship. Pattern similarity and other measures that it depends on are defined as follows.
Edit distance, or Difference
<math>
Delta(a,b) := text{number of insertion,deletion and modification to change } a rightarrow b </math>
Difference ratio
<math>
delta(a,b) := frac{Delta(a,b)}{max(|a|,|b|)} </math>
Similarity
<math>
a sim_theta b iff delta(a,b) < theta text{, where } theta text{ is a user-defined threshold } </math>
The patterns and their similarity relations form a graph <math>G(V,sim_theta)</math> whose connected components can be treated as clusters of similar patterns. However, some components can be loosely connected (e.g. a chain or a fork) and render poor quality of cluster. We can measure the looseness of a connected component by using average pairwise <math>delta</math> measurement for patterns in the component. Hence, if a component’s looseness is higher than acceptable value, meta-clustering will sub-cluster that component using the same algorithm with lower difference threshold (hence it is harder for a pair of patterns to be similar, resulting in lower looseness but more of components). The new difference threshold is identified by old difference threshold and the ‘–meta-speed’ option, by new_threshold = old_threshold / speed. Because of this, speed must be greater than 1 or the process may not terminate. This process is repeated until all components (clusters) satisfy the looseness threshold. The pseudo-code of this process is described as follows.
# NOTE: Array index start from 0

define cluster_t pattern_t[];
double SPEED; # User-defined speed of sub-clustering

subroutine cluster(pattern_t[] P, double THETA, double LOOSENESS_THRESHOLD)
  cluster_t[] COMPS = connected_components(P, THETA);
  cluster_t[] RET_CLUSTERS;
  foreach C in COMPS do
    if (looseness(C) > LOOSENESS_THRESHOLD)
      cluster_t[] SUB_C = cluster(C, THETA/SPEED, LOOSENESS_THRESHOLD);
      foreach X in SUB_C do
        RET_CLUSTERS.push(X);
      endforeach
    else
      RET_CLUSTERS.push(C);
    endif
  endforeach
  return RET_CLUSTERS;
endsubroutine cluster
The looseness subroutine is defined as follows:
# looseness = average pairwise diff_ratio
subroutine looseness(cluster_t C)
  double sum = 0;
  int N = length(C);
  for i=0 .. N-1 do
    for j=0 .. N-1 do
      sum += diff_ratio(C[i],C[j]);
    endfor
  endfor
  return sum / (N*(N-1)/2);
endsubroutine
The connected_components subroutine is defined as the following:
# This simply identifying connected components
subroutine connected_components(pattern_t[] C, THETA)
  foreach P in C do
    P.label = 0;
  endforeach
  int CURRENT_LABEL = 0;
  foreach P in C do
    if (!P.label)
      P.label = ++CURRENT_LABEL;
      pattern_t[] stack;
      stack.push(P);
      while (!stack.empty())
        pattern_t P1 = stack.pop();
        foreach P2 in C s.t. similar(P1,P2,THETA)
          if (!P2.label)
            P2.label = CURRENT_LABEL;
            stack.push(P2);
          endif
        endforeach
      endwhile
    endif
  endforeach
  cluster_t RET_COMP[];
  for L=1 .. CURRENT_LABEL do
    RET_COMP[L] = all L in C s.t. (L.label == L);
  endfor
  return RET_COMP;
endsubroutine
| Option | Lower Value | Higher Value |
|---|---|---|
| meta-ratio | More initial (but small) meta-clusters, potentially low looseness, but may result in over-specific clusters | Less initial (and bigger) meta-clusters, potentially higher looseness, sub-clustering will take care of the initial over-grouping issue but can be slow (depends on meta-speed and initial cluster size) |
| meta-speed | Slower, but potentially more satisfying results | Faster, but may results in more meta-clusters and over-specific clusters |
| meta-looseness | Potentially more satisfying results, but too low of this value will result in over-specific clusters and can be slow too if the speed is low | Too high of this value can result in over-grouping clusters |
GUI
To use Baler GUI, run the following command in the command line:
baler-gui
The same GUI is also available as a view in Ovis’s Baron.
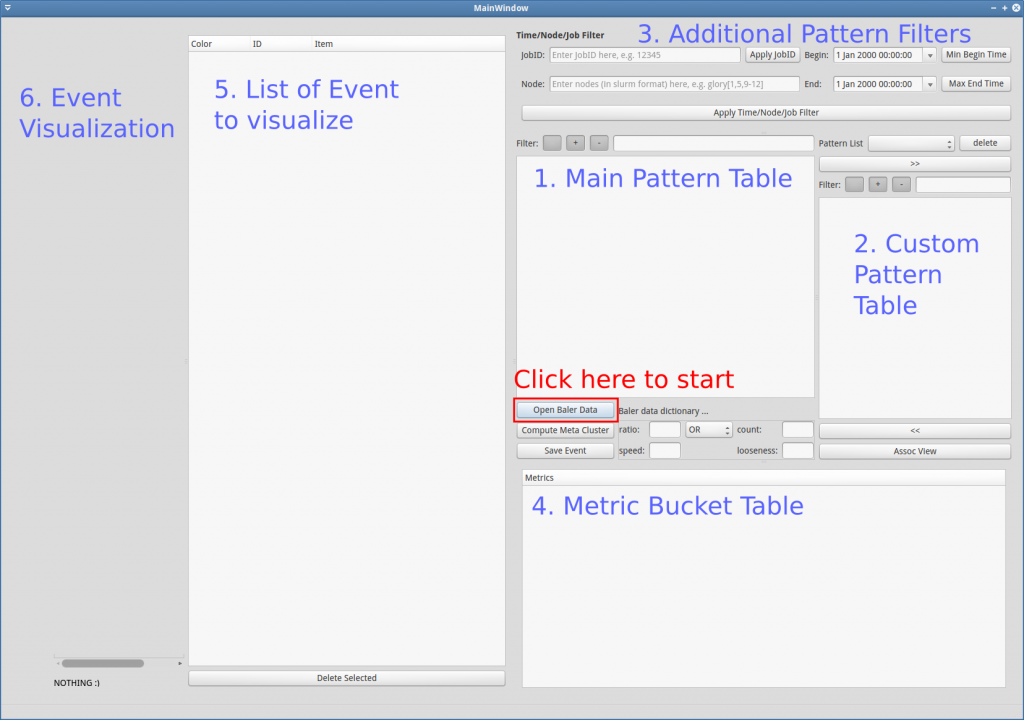
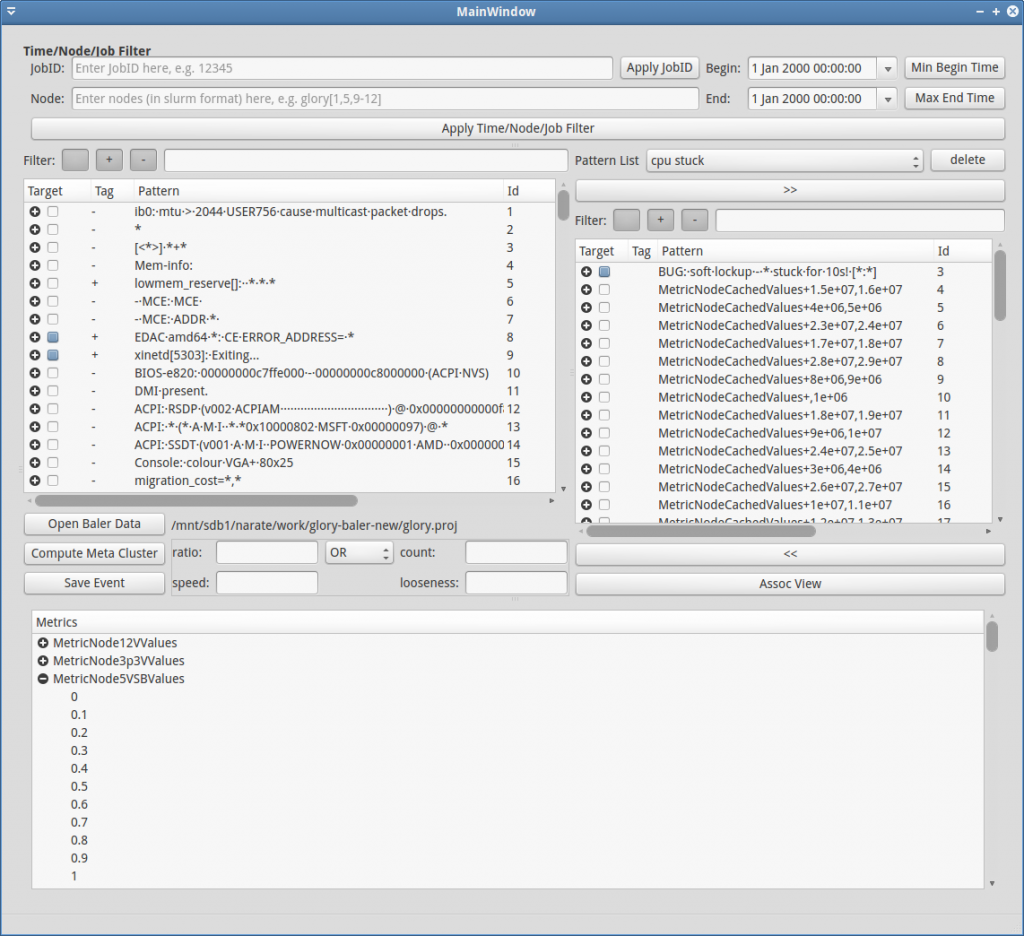
The overview explanation for each part of the GUI (Figure GUI-1) is as follows:
- Main Pattern Table: This is the area where the all meta-patterns (and 1-patterns) are displayed. This table can be filtered by regular expression/tags using the “Filter:” above it. It can also be filtered by time and locations specified in area 3. Additional Pattern Filters
- Custom Pattern Table: This is the area where users can add/remove/regroup 1-patterns freely
- Additional Pattern Filters: This area contains additional time / locations filter for the main pattern table (1). JobID can also be specified to obtain time/location filter according to it.
- Metric Bucket Table: This is a table where users can define buckets for each metric.
- List of Event to Visualize: This area contains list of events for visualization. Users can drag 1-patterns or meta-patterns from area (1), (2) or (4) and drop into this area to specify events to visualize.
- Event Visualization: This is the area to illustrate event occurrences in spatiotemporal plane.
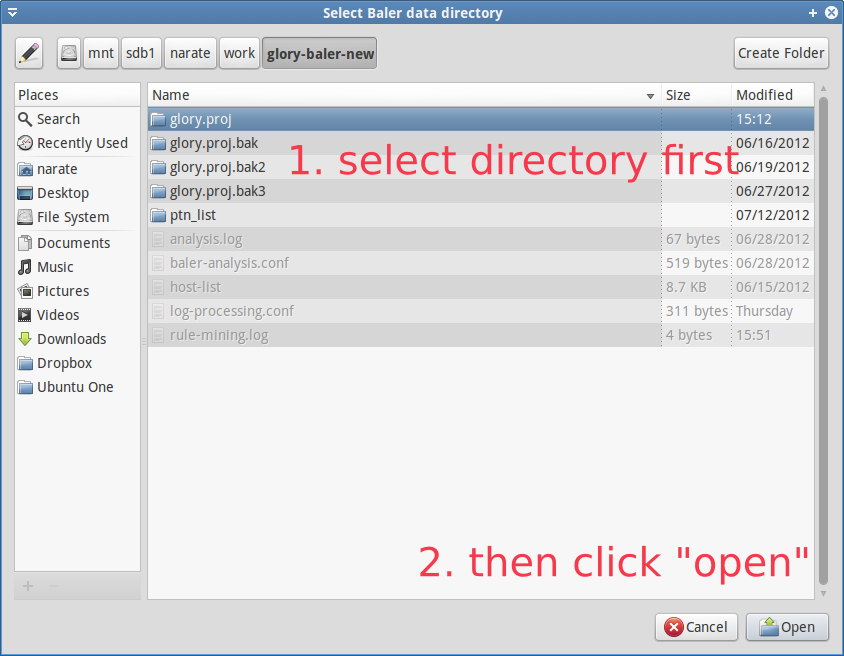
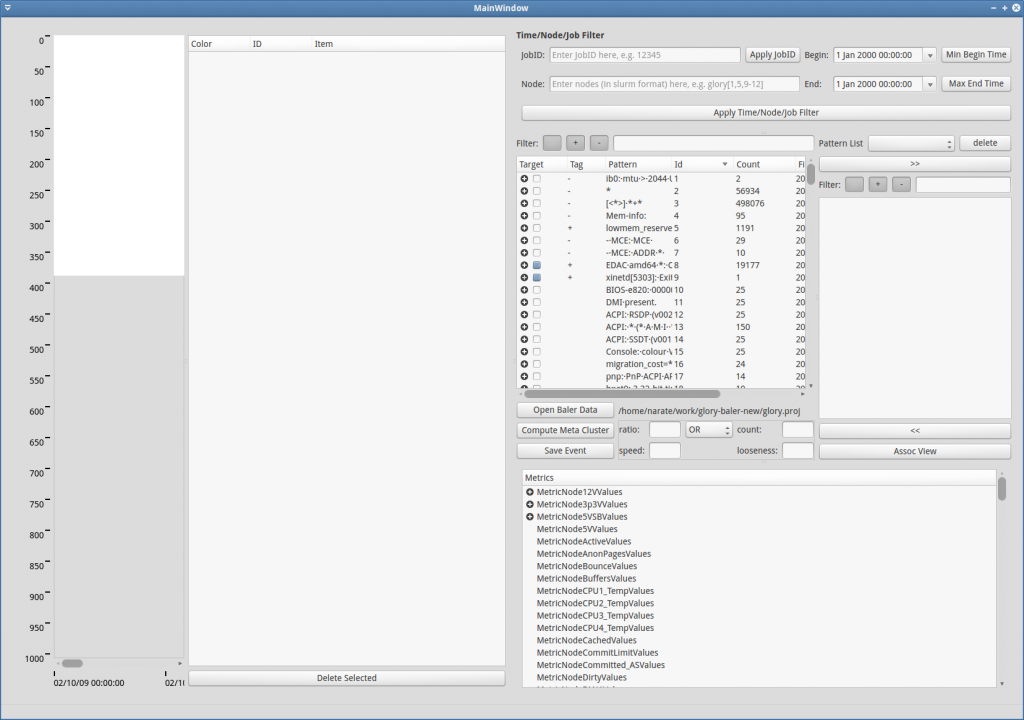
In order to explore or further analyze the processed data, users have to load the processed data first. To load the process data, click Open Baler Data (red rectangle in Figure GUI-1). Then, navigate to the output directory that are structurally stored the processed data by log-clustering2 (refer to Figure GUI-2). After the data is loaded, the main pattern table should be filled, and if the metric data are presented in the database, they should also appear in the metric bucket table (see Figure GUI-3).
The data exploration and further analysis are covered in Pattern Exploring, Events & Event Visualization and Association-Rule Mining accordingly.
Pattern Exploring / Manipulation
One of the main purposes of baler is to provide better understanding about contents in log files. Even though this can be achieved through log message pattern extraction, pattern exploration through a text editor (e.g. in Vim) can be inconvenient. Pattern Exploring components in Baler GUI will help this task.
A usual usecase for pattern exploring is to take a look at each pattern and consider whether it is interesting or uninteresting, and wheter it should be a target to mine for related rules (will discuss more about this in Association-Rule Mining). Then, by pressing
- the ‘+’ key or ‘=’ key on the keyboard, the current selected item(s) will be tagged with ‘+’, representing interesting patterns
- the ‘-‘ key on the keyboard, the current selected item(s) will be tagged with ‘-‘, representing uninteresting patterns
- the ‘/’ key on the keyboard, the tag(s) of current selected item(s) will be cleared.
- the ‘space’ key on the keyboard, the target status(es) of the current selected item(s) will be toggled
Through this pattern scan-through process, if a cluster is found to be bad (e.g. over group), the user can intervine the meta-grouping by either re-issuing the automatic meta-clustering with new set of parameters (ratio, speed, looseness) or manually form new meta-cluster by
- select wanted 1-patterns (holding CTRL key to select multiple items)
- right click –> new group
CAUTION re-issuing automatic meta-clustering will cause all meta-clusters lost their statuses (since they’re all new).
Do not worry that you will lose any 1-patterns in the main pattern table, you won’t be able to delete them. All you can do is moving them around to different groups.
The cherry-picking process is a one-time big effort. When the processed data are updated with the new data, users can choose to see only untagged patterns, which are the new ones. The unseen data are expected to be much less than the first-run data.
Customizable Pattern List
The custmoizable pattern list is located to the right of the main pattern list (see Figure GUI-4). You may add/delete 1-patterns, meta-clusters to this list freely. To create a new customizable list, click the “Pattern List” combobox -> <new list>. Then, you can start manipulating it (e.g. move some patterns in, etc.). The overall control on this list is the same as the main list, except that in this list users can actually remove the 1-patterns.
New groups can be created usually by drag & drop from other lists (main list or metric bucket list). If you somehow accidently add things into a group and want to separate items in the group individually, you may do so by right-click at the group –> “split group.”
Pattern Filtering
To ease pattern exploring process, Baler also offer pattern display filtering capability. Baler can offer the patterns by
- Regular Expression: users can enter the regular expression in the LineEdit next to Filter:
- Tags: for ” “, “+” and “-” buttons, pressed-down means inclusive filter (want to see), unpressed means exclusive filter (do not want to see).
- Time: enter begin / end of the time window and click “Apply Time/Node/Job Filter” button to inclusively filter patterns that exist during the specified time. Click “Min Begin Time” and “Max End Time” for the very beginning time (of the data) and the very end of time (of the data) respectively.
- Locations: locations, in slurm node description format, e.g. glory[1,3,7-9]
- JobID: after entering JobID, press “Apply JobID” to update the time/locations that the Job occupy the system. Then, click “Apply Time/Node/Job Filter” button to apply the time / node filter.
Events & Event Visualization
An instance of an event, in Baler context, is defined to be an instantiation of a message that belong to a meta-cluster at a specific location-time, represented as . In other words, meta-clusters define events (or rather event types). Thus, it is very crucial for users to carefully define meta-clusters for the best event representation.
Metric Event
In addition to log-message-based events, users can also define metric events. Usually metric data are continuous-valued time series. An approach to make them compatible with other event occurrence data is to form events out of them by discretizing the ranges of each series. For example, MetricNode5VValue[4.1,4.2) represents the event that 5V sensor value falls in the range of [4.1, 4.2). Now that the metrics can be setup as events, we may use these metric events in conjunction with regular log events.
Generate Buckets in a Batch users can select multiple (or single) metrics, right click –> generate bucket for selected metric… –> specify min, max and increment to generate multiple buckets (same setup) at the same time.
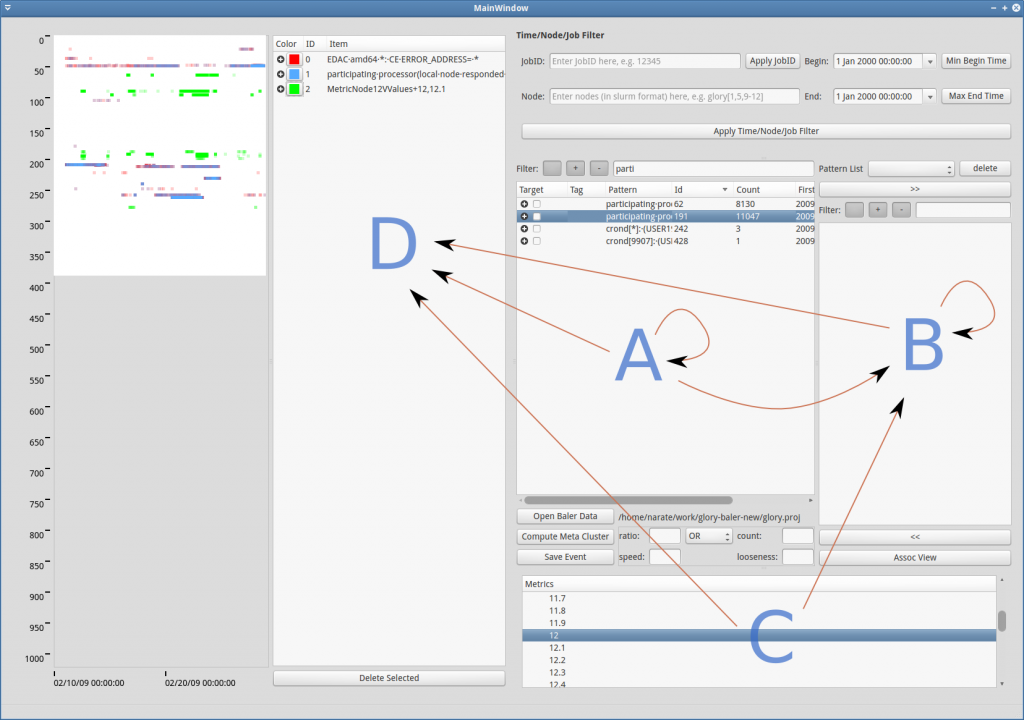
Drag & Drop
The image below (Figure GUI-5) shows possible drag & drop interactions among tables which are described as follows:
- A->A: change group
- B->B: change group
- A->B: add group from main list to customizable list
- C->B: add metric events into the customizable list (for further analysis, like association rule mining)
- A->D, B->D, C->D: add events for visualization
Association-Rule Mining
Now that we can define a bunch of events, we would like to know how they’re related. One interesting way to describe their relation is ‘association’ in occurrences. For example, we may want to know whether if events A and B occur, will event C occur afterward? In this setting, we may say C is the target and {A, B} is the antecedent of C. This setup is represented as {A, B}->{C}, and is called a rule candidate.
Let X and Y be sets of events, define
- ||X|| be the number of co-occurrence of events in X
- conf( X->Y ) = ||XY||/||X||
Then, if conf({A, B}->{C}) is close to 1, the candidate becomes a rule. In the contrary, if the confidence of the candidate is close to 0, the candidate will not be considered a rule. In Baler, if the confidence is greater than the confidence threshold, then the candidate is a rule. The goal of association rule mining in Baler is to minimally find rules that match all the criteria. One of the criteria is the confidence threshold as we discussed.
The rest of the criteria are discussed as follows.
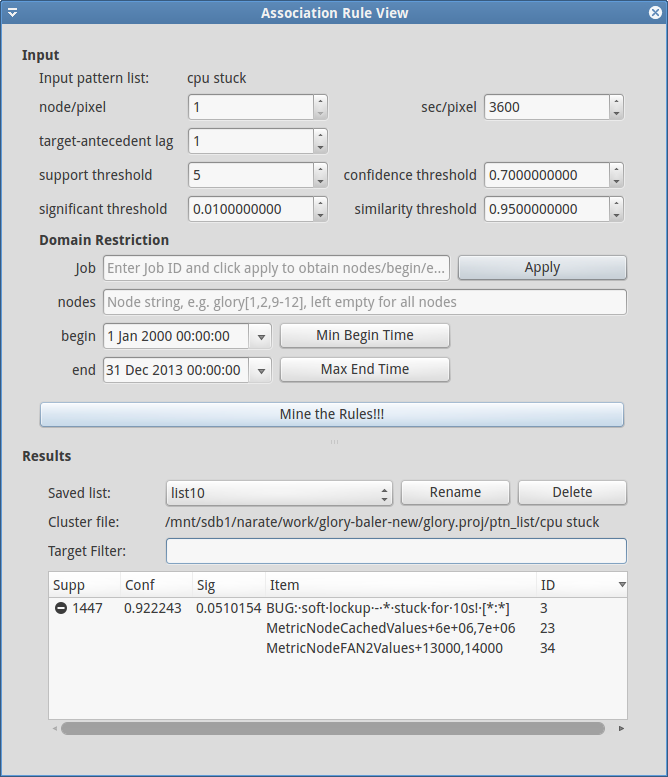
node/pixel and sec/pixel T
he co-occurrence in Baler is estimated by summing the generated co-occurring event image, which is a pixel-wise minimization of the corresponding event images. Hence, choosing the size of node/pixel and sec/pixel can greatly affect the measurement. Too-small sec/pixel will almost surely cause 0 co-occurrence. Too-large sec/pixel (e.g. a day) may mislead the concept of co-occurring.
target-antecedent lag
Sometimes, we may be interested in relating the antecedents with the future target (e.g. for predicting), the target then should be shifted before merging (in co-occurrence measure). This shifting can be specified in target-antecedent lag (default:0, i.e. no shift).
support threshold
The support of a rule X->Y is ||XY||, which basically tells how many times that the rule has occurred. Even though a rule has high confidence, with significantly low support, it can become insignificant. The candidate that has support lower than the support threshold will not be considered as a rule.
significance threshold
The significance value of a rule X->Y is conf(Y->X) (the confidence of the reversed rule). It describes how much impact the antecedent X has in Y. A high-confidence rule with low significant may indicate spurious relation. A rule of significance lower than the significance threshold will not be considered as a rule.
similarity threshold
Similarity of two images P and Q is defined as ||PQ||/max(||P||, ||Q||). In the rule-searching if we’re on the branch {A,B}->{C}, and we’re about to branch out the search in to {A,B,X}->{C}, we should check first whether adding X into the antecedent give the candidate more information. If {A,B} is very similar to {A,B,X}, we say that adding X does not help much and hence we should not go into that branch. Two images are considered to be similar if their similarity is greater than the similarity threshold.
In addition to these search parameters, users can also restrict the image domain using locations (nodes) and time (begin/end). Users can also use Job (JobID) to specify the locations and time corresponding to the job (restricting the rule-searching for only what happened during the job run).
The mined rules are presented in the table at the bottom of the dialog, and automatically saved using list### format (can be manually Rename by users). Each expandable line in the table represents target part of the mined rule and the expanded items under it are the antecedents. Please also note that when users select a Saved list the parameters that have been used at the mining time will also be loaded and set in the GUI. In addition, Mine the Rule!!! will always create a new list without overwrite the old ones.
Future Features
- Web-based GUI
- Independent S/W Component design Client-Server model
- Multiple processing server for scalability
- Portable