Draft…in progress… (This page describes software which is no longer supported as of 2017).
Shepherd
Running the Shepherd (on an existing database)
shepherd --name=cds --database=mysql://ovis@localhost/cdsL2_0706 --http-port-spec=8080
This will start the shepherd to use the database with the database called cdsL2_0706 and it will use port 8080 to accept curl commands (used internally) for some queries. (If the data were to be located in more than 1 database, then multiple shepherds would be started with different databases but the same name.)
Building a Database
The database is built using the ovis-db utility. This installs the database tables using the cluster component and data information in an XML file. For example, the test files in the ovis release include a testonecpu.ovdb file which includes lines like:
 <component_type
     type="cn" category="node" is_container="1"
     glyph_shape="render/RackNode1USimplified.vtp"
     manufacturer="Appro"
     make="Supermicro"
     model="H8QM8"
     description="Glory compute node, Quad-Core AMD Opteron Processor 8354, 32XGB RAM"
     slot_origin="10,-10,10"
     slot_size="112,600,24"
     slots_per_axis="4,1,1"
     slot_frame="1,0,0,  0,1,0,  0,0,1"
     width="550" depth="600" height="44">


     <sampler name="ovMetricNodePositionSampler" interval="-1">
       <metric name="PositionX"         units="m"         storage_type="float" frequency="once" constancy="time"/>
       <metric name="PositionY"         units="m"         storage_type="float" frequency="once" constancy="time"/>
       <metric name="PositionZ"         units="m"         storage_type="float" frequency="once" constancy="time"/>
     </sampler>


     <sampler name="ovMetricLinuxProcNetDevSampler" interval="5">
       <metric name="Eth0TxBytes"       units="1"         storage_type="int"    frequency="delta"/>
       <metric name="Eth0RxBytes"       units="1"         storage_type="int"    frequency="delta"/>
       <metric name="Eth0TxPackets"     units="1"         storage_type="int"    frequency="delta"/>
       <metric name="Eth0RxPackets"     units="1"         storage_type="int"    frequency="delta"/>
       <metric name="L0TxBytes"       units="1"         storage_type="int"    frequency="delta"/>
       <metric name="L0RxBytes"       units="1"         storage_type="int"    frequency="delta"/>
       <metric name="L0TxPackets"     units="1"         storage_type="int"    frequency="delta"/>
       <metric name="L0RxPackets"     units="1"         storage_type="int"    frequency="delta"/>
     </sampler>
   </component_type>
which define the types of components and the data that will be collected from them.
And lines like:
   <instances>
   <components type="rack" numbered="1-3"/>
   <components type="cn"   numbered="1-4"/>
   <components type="cpu"   numbered="1-16"/>
   <components type="core"   numbered="1-32"/>
 </instances>


 <associations>
   <association label="physical" type="containment">
     <container type="rack" num="1" position="0,0,0" orientation="1,0,0, 0,1,0, 0,0,1">
	<container type="cn" num="1" slot="0,0,23" name="e0">
         <container type="cpu" num="1" slot="0,0,0" name="e0c0">
           <component type="core" num="1" slot="0,0,0" name="e0c0c0"/>
           <component type="core" num="2" slot="1,0,0" name="e0c0c1"/>
           <component type="core" num="3" slot="2,0,0" name="e0c0c2"/>
           <component type="core" num="4" slot="3,0,0" name="e0c0c3"/>
         </container>
         <container type="cpu" num="2" slot="1,0,0" name="e0c1">
           <component type="core" num="5" slot="0,0,0" name="e0c1c0"/>
           <component type="core" num="6" slot="1,0,0" name="e0c1c1"/>
           <component type="core" num="7" slot="2,0,0" name="e0c1c2"/>
           <component type="core" num="8" slot="3,0,0" name="e0c1c3"/>
         </container>
         <container type="cpu" num="3" slot="2,0,0" name="e0c2">
           <component type="core" num="9" slot="0,0,0" name="e0c2c0"/>
           <component type="core" num="10" slot="1,0,0" name="e0c2c1"/>
           <component type="core" num="11" slot="2,0,0" name="e0c2c2"/>
           <component type="core" num="12" slot="3,0,0" name="e0c2c3"/>
         </container>
         <container type="cpu" num="4" slot="3,0,0" name="e0c3">
           <component type="core" num="13" slot="0,0,0" name="e0c3c0"/>
           <component type="core" num="14" slot="1,0,0" name="e0c3c1"/>
           <component type="core" num="15" slot="2,0,0" name="e0c3c2"/>
           <component type="core" num="16" slot="3,0,0" name="e0c3c3"/>
          </container>
	</container>
      </container>
    </association>
   </associations>
Which define the instances of the components and how they are laid out.
You will need to create this XML file for your cluster and you will use the ovis-db utility to use this information to build the database tables for your machine (This is described in the OVIS users guide). Collection of data is (will be) described below).
Baron
Connecting to the Shepherd
baron
This will pop a Browser with the shepherd discovered via avahi:
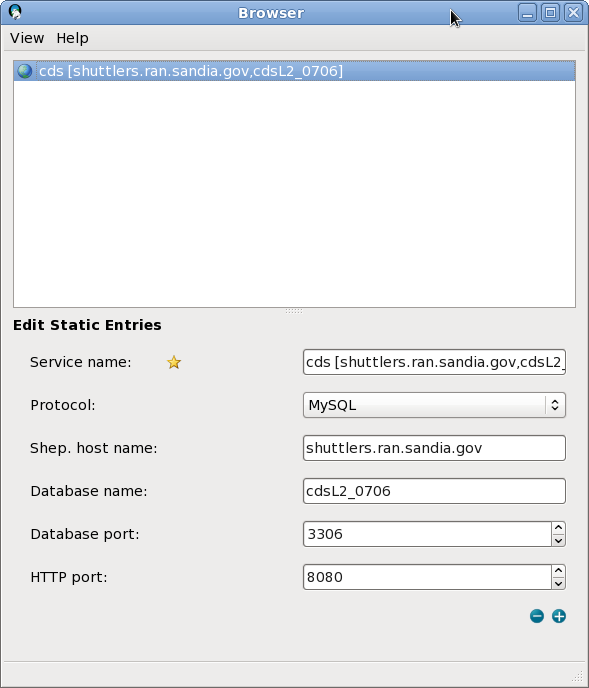
You can use the avahi discovered shepherd or add a static entries. These can be saved by hitting the plus sign in lower right corner to add this option to your entries. They will appear with a star next to them. Henceforth, you can double click on starred entries directly to bring up the Server Connection Window.
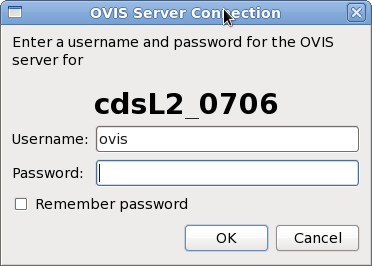
Fill out the Server Connection window as below and hit OK (Username and password that have been granted appropriate database access from localhost):
The baron will appear:
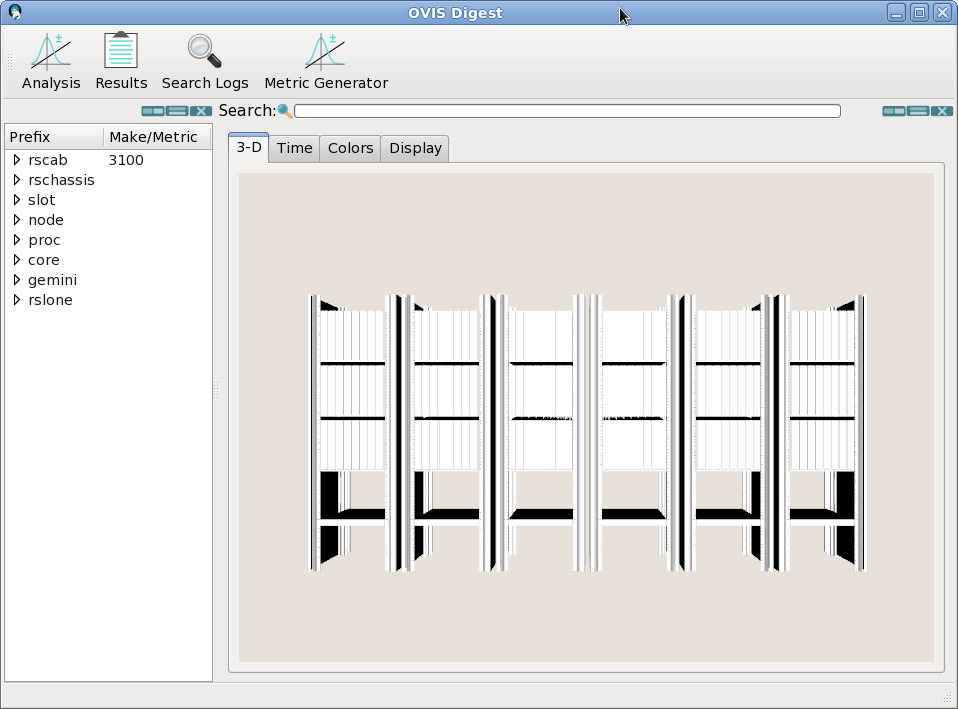
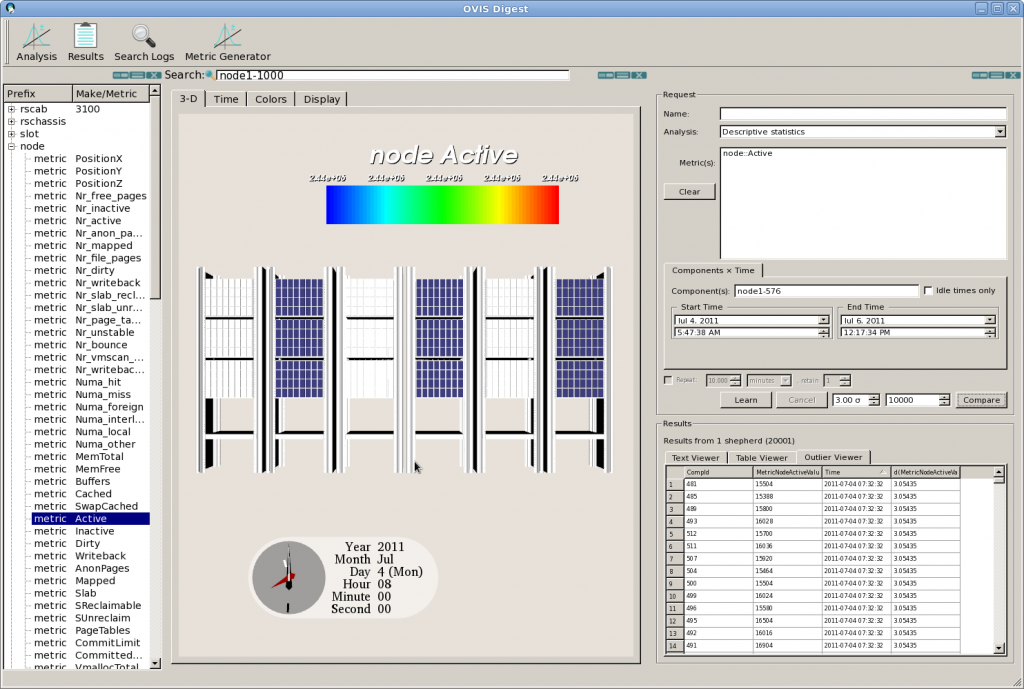
Some Features of the UI
OVIS 3-D interface allows:
- drag and drop metrics from the list to the 3D display
- play through time using the clock manually or automatically (Time Tab)
- pop out components by specification in the search bar. Can optionally color popped-out components only
- change color scale using the Colors Tab
- Analyses using the Analysis pane
Analysis in the Baron
Learn:
- Bring up an analysis pane
- Drop a metric, set components, set time range, press learn
- Results will be in the “Text Viewer” Pane
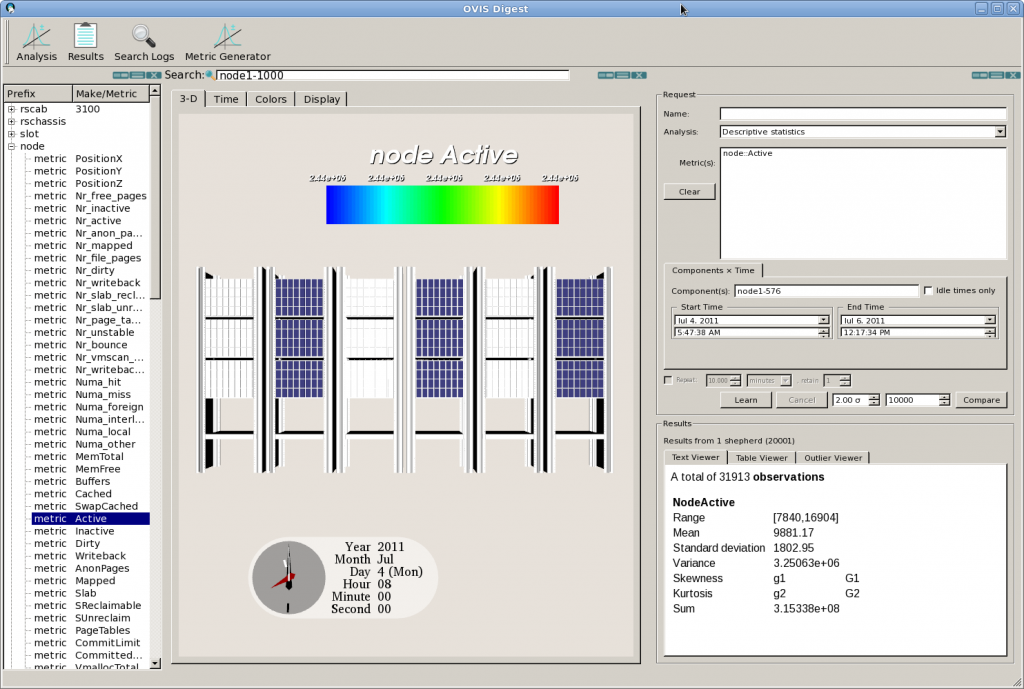
- hit “Cancel” When results appear
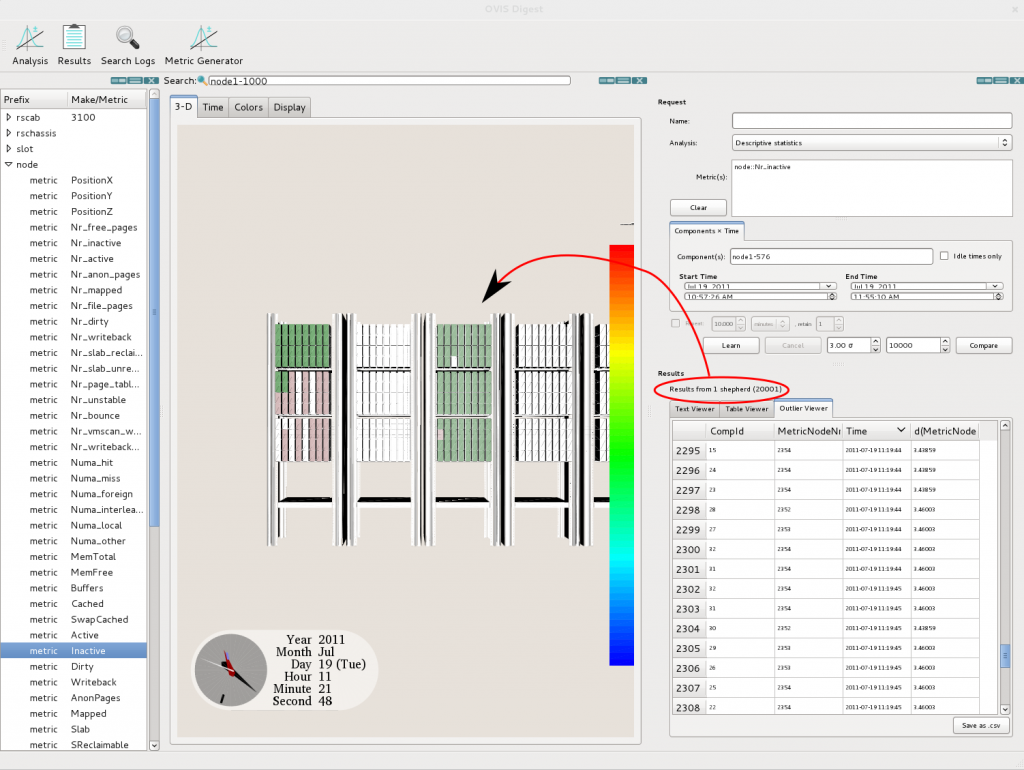
Assess (look for outliers relative to the learned model):
- change std deviation and any components, time range that you like
- there is also a “limit” spin box. This currently limits the number of data instances that will be compared against the model in order to cap the overall time of the comparison. This is not the number of outliers, but rather the number of instances that will be checked for outliers. This methodology will be revised in the near future.
- hit “Compare”
- Results will be in the “Outlier Viewer” Pane. This is a spreadsheet and thus columns can be clicked on to order by value. The values can also be saved to a csv file by clicking on the “save as .csv file” button.
Assess in the visualization: You can also see outliers colored in the 3D display. After you have performed an assess analysis you can drag the “Results from 1 shpeherd” line to the display. You can at this time time the std dev threshold as well. This will color the components in the display blue, red, or, green to represent if their instantaneous values are below, within, or above the std dev threshold respectively.
Data Collection
Previous versions of OVIS used OVIS components called sheep to collect data from system components and to insert that data into the database directly. The current version of OVIS uses LDMS to transport data off the cluster, to optionally aggregate it, and to insert data into the database. LDMS is more lightweight and versatile than the previous method. Users write data collectors that insert data into the local LDMS Metric Set. More on this coming soon…