Lightweight Distributed Metric Service (LDMS): Design and API Documentation
LDMS is the data collection, transport, and storage component of the OVIS suite of tools.
Documentation
High Level End to End
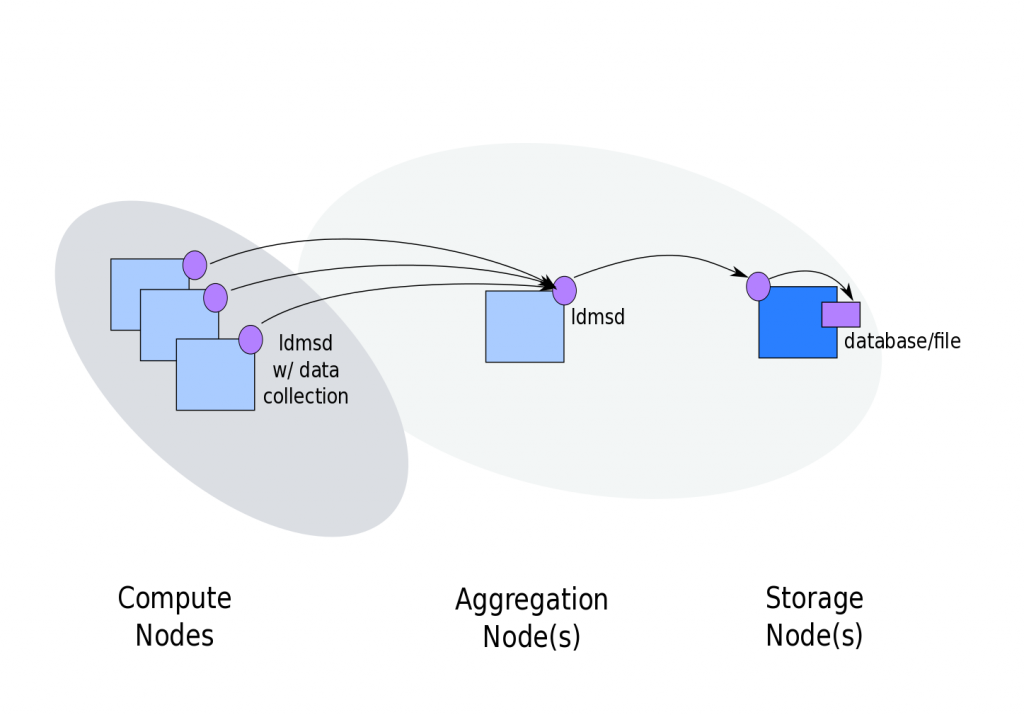
This diagram shows the base component, the LDMS daemon (ldmsd), being utilized in three different roles:
- Running collection plugins (samplers) on monitored hosts (shown on left)
- Aggregating information from other ldmsds running collection plugins (aggregators) (shown in center)
- Storing information from other daemons collection plugins (shown on right )
Note1: ldmsds performing an aggregation function can also run collector plugins.
Note2: ldmsds performing a store function will not store its own metric sets.
Logical Components
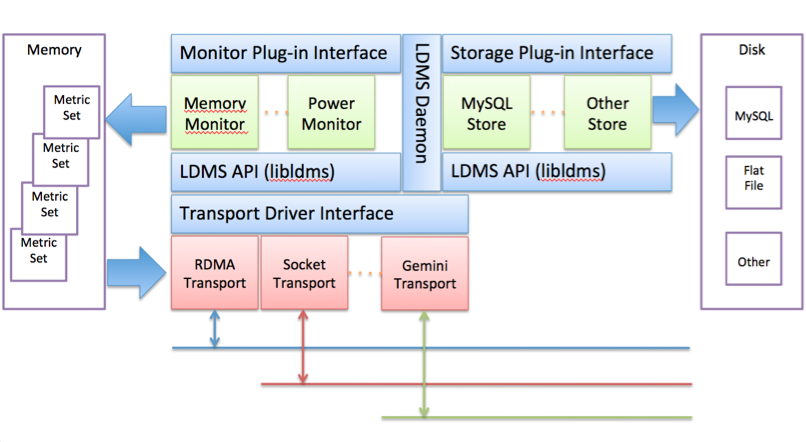
This diagram shows the major logical components of LDMS and their relationships to each other. Collectors and Stores are both plugins to LDMS. Any number of these may be simultaneously configured. Data is then transported over the specified transport.
Data Flow
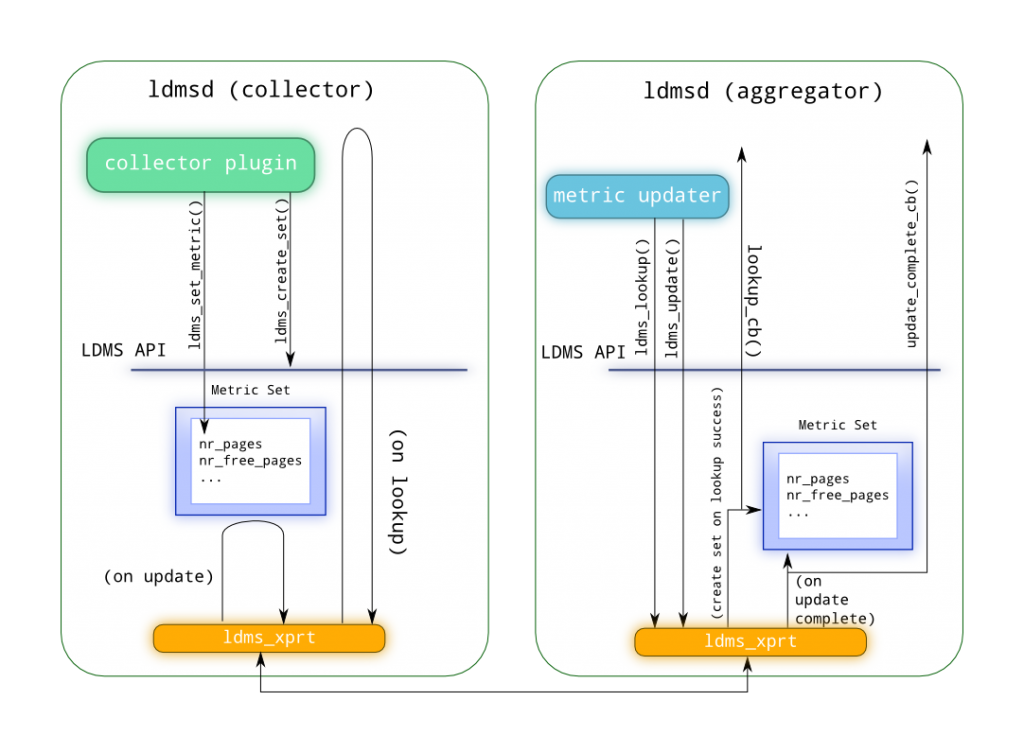
This diagram shows the control and data communication paths between two peer ldmsds.
Metric Set Memory Organization
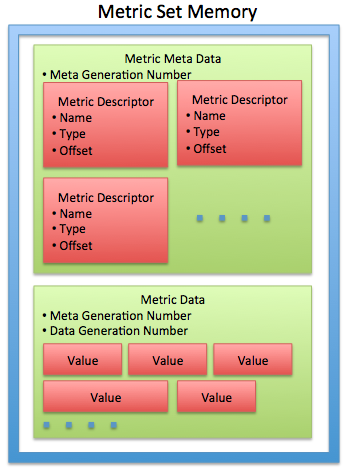
This diagram shows the metric set memory organization into two separate chunks:
- The Metric Meta Data describes each datum in a set in terms of Name, Data Type, Component ID, and offset in the Metric Data chunk
- The Metric Data carries generation numbers for both Meta Data and Data (to enable change detection), as well as the actual data
Note: Only Metric Data is repeatedly collected. The Metric Meta Data is transmitted only when the connection is first established and if change is detected.
Timing Results
The collector configuration supports the specification of an interval and offset that can be used to synchronize collection across the system in order to provide system snapshots. Collection is determined with respect to each system’s time and therefore this is best used when something like ntp is used to synch the clocks. This section presents some general timing results.
Idle Nodes
- Sample interval 1 sec with 0 offset, Aggregator interval 30 sec with 0.2 sec offset
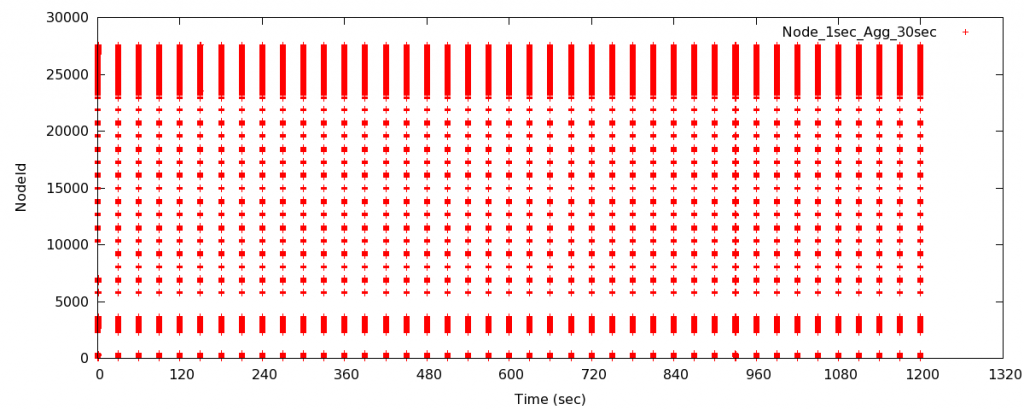
- Figure 1 shows the collection times to be nicely spaced at 30 second intervals with all samples for a particular collection interval taken from the same second
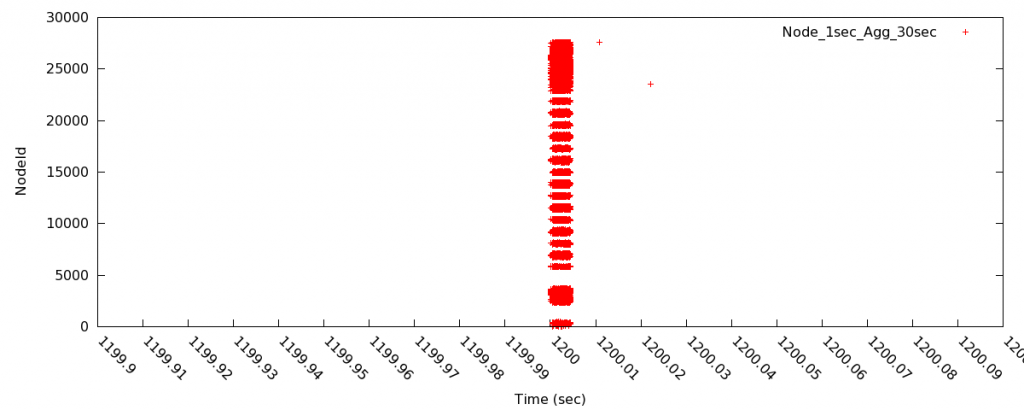
- Figure 2 zooms in to show the tight grouping of the samples. The time tick marks are at 10ms intervals and the majority (9998/10000) are grouped within ~5ms
- These times are from the perspective of the nodes and so the grouping with respect to the NTP reference could be wider
- Description of text output:
- Sample (first field) is the average timestamp (in sec)
- NumPts (second field) is the number of points included in the calculation (should be the number of nodes being sampled)
- NodeTimeRange (third field) is the time difference between the earliest time stamp and the latest time stamp as reported by the nodes running samplers
- (fourth field) is the nid number associated with the earliest timestamp for this sample
- MinNodeDT (fifth field) is: (earliest timestamp for this sample) – (average timestamp for this sample)
- (sixth field) is the nid number associated with the latest timestamp for this sample
- MaxNodeDT (seventh field) is: (latest timestamp for this sample) – (average timestamp for this sample)
- Note that the farthest outlier in both sets of runs is always the same node which may point to some anomalous process running on this node
- It can be seen from these results that:
- Synchronization results in tight grouping of samples with respect to a nodes idea of time
- The actual width depends on how closely a node is synced to the NTP server which we can’t know without collecting additional information from a node
- Given that each aggregation results in capture of the same second’s data from each node the “sweep” time for aggregating 10K nodes can be bounded at less than 0.8 second
- The 0.8 derives from using a 0.2 sec offset which means that the aggregator didn’t start its aggregation until 0.2 sec after the samples were taken and still did not get any samples from a different sample
- Without also collecting the aggregator’s timestamp for each collection we cannot know the actual time for a “sweep”
- Synchronization results in tight grouping of samples with respect to a nodes idea of time
Ave Occurence NID From Ave NID From Ave
Sample 1381680930.0024: NumPts 10000 NodeTimeRange 0.00434303283691406 MinNodeDT ( 3451) -0.00229310989379883 MaxNodeDT  ( 25419) 0.00204992294311523
Sample 1381680960.0024: NumPts 10000 NodeTimeRange 0.00434207916259766 MinNodeDT ( 3451) -0.00229287147521973 MaxNodeDT  ( 13844) 0.00204920768737793
Sample 1381680990.0024: NumPts 10000 NodeTimeRange 0.00434708595275879 MinNodeDT ( 6922) -0.00229644775390625 MaxNodeDT  ( 25419) 0.00205063819885254
Sample 1381681020.0024: NumPts 10000 NodeTimeRange 0.00435805320739746 MinNodeDT ( 6922) -0.00229620933532715 MaxNodeDT  ( 6785) 0.00206184387207031
Sample 1381681050.0024: NumPts 10000 NodeTimeRange 0.0218861103057861 MinNodeDT ( 6922) -0.00229716300964355 MaxNodeDT  ( 23513) 0.0195889472961426
Sample 1381681080.0024: NumPts 10000 NodeTimeRange 0.00434708595275879 MinNodeDT ( 6922) -0.00229525566101074 MaxNodeDT  ( 25419) 0.00205183029174805
Sample 1381681110.0024: NumPts 10000 NodeTimeRange 0.0043489933013916 MinNodeDT ( 6922) -0.00229477882385254 MaxNodeDT  ( 25419) 0.00205421447753906
Sample 1381681140.0024: NumPts 10000 NodeTimeRange 0.0043480396270752 MinNodeDT ( 6922) -0.00229454040527344 MaxNodeDT  ( 25419) 0.00205349922180176
Sample 1381681170.0024: NumPts 10000 NodeTimeRange 0.00433802604675293 MinNodeDT ( 6922) -0.00229287147521973 MaxNodeDT  ( 27422) 0.0020451545715332
Sample 1381681200.0024: NumPts 10000 NodeTimeRange 0.0216939449310303 MinNodeDT ( 6922) -0.00229716300964355 MaxNodeDT  ( 23513) 0.0193967819213867
Sample 1381681230.0024: NumPts 10000 NodeTimeRange 0.00434708595275879 MinNodeDT ( 6922) -0.00229430198669434 MaxNodeDT  ( 25419) 0.00205278396606445
Sample 1381681260.0024: NumPts 10000 NodeTimeRange 0.0043480396270752 MinNodeDT ( 6922) -0.00229406356811523 MaxNodeDT  ( 25419) 0.00205397605895996
Sample 1381681290.0024: NumPts 10000 NodeTimeRange 0.00434589385986328 MinNodeDT ( 6922) -0.00229263305664062 MaxNodeDT  ( 25419) 0.00205326080322266
Sample 1381681320.0024: NumPts 10000 NodeTimeRange 0.0043480396270752 MinNodeDT ( 6922) -0.00229430198669434 MaxNodeDT  ( 25419) 0.00205373764038086
Sample 1381681350.0024: NumPts 10000 NodeTimeRange 0.0219190120697021 MinNodeDT ( 6922) -0.00229668617248535 MaxNodeDT  ( 23513) 0.0196223258972168
Sample 1381681380.0024: NumPts 10000 NodeTimeRange 0.00434994697570801 MinNodeDT ( 6922) -0.00229310989379883 MaxNodeDT  ( 25419) 0.00205683708190918
Sample 1381681410.0024: NumPts 10000 NodeTimeRange 0.00433993339538574 MinNodeDT ( 6922) -0.00229310989379883 MaxNodeDT  ( 25419) 0.00204682350158691
Sample 1381681440.0024: NumPts 10000 NodeTimeRange 0.00434589385986328 MinNodeDT ( 6922) -0.00229287147521973 MaxNodeDT  ( 25419) 0.00205302238464355
Sample 1381681470.0024: NumPts 10000 NodeTimeRange 0.00434494018554688 MinNodeDT ( 6922) -0.00229263305664062 MaxNodeDT  ( 25419) 0.00205230712890625
Sample 1381681500.0024: NumPts 10000 NodeTimeRange 0.0104770660400391 MinNodeDT ( 6922) -0.00229358673095703 MaxNodeDT  ( 27595) 0.00818347930908203
Sample 1381681530.0024: NumPts 10000 NodeTimeRange 0.00434589385986328 MinNodeDT ( 6922) -0.00229310989379883 MaxNodeDT  ( 18394) 0.00205278396606445
Sample 1381681560.00239: NumPts 10000 NodeTimeRange 0.00434398651123047 MinNodeDT ( 6922) -0.00229048728942871 MaxNodeDT  ( 25419) 0.00205349922180176
Sample 1381681590.00239: NumPts 10000 NodeTimeRange 0.00434589385986328 MinNodeDT ( 6922) -0.00229072570800781 MaxNodeDT  ( 25419) 0.00205516815185547
Sample 1381681620.00239: NumPts 10000 NodeTimeRange 0.0043480396270752 MinNodeDT ( 6922) -0.00228977203369141 MaxNodeDT  ( 25419) 0.00205826759338379
Sample 1381681650.0024: NumPts 10000 NodeTimeRange 0.021920919418335 MinNodeDT ( 6922) -0.00229501724243164 MaxNodeDT  ( 23513) 0.0196259021759033
Sample 1381681680.00239: NumPts 10000 NodeTimeRange 0.00434494018554688 MinNodeDT ( 6922) -0.0022892951965332 MaxNodeDT  ( 25419) 0.00205564498901367
Sample 1381681710.00239: NumPts 10000 NodeTimeRange 0.00433993339538574 MinNodeDT ( 6922) -0.00229120254516602 MaxNodeDT  ( 27422) 0.00204873085021973
Sample 1381681740.00239: NumPts 10000 NodeTimeRange 0.00434589385986328 MinNodeDT ( 6922) -0.00228977203369141 MaxNodeDT  ( 25419) 0.00205612182617188
Sample 1381681770.00239: NumPts 10000 NodeTimeRange 0.00434517860412598 MinNodeDT ( 13967) -0.00229334831237793 MaxNodeDT  ( 25419) 0.00205183029174805
Sample 1381681800.00239: NumPts 10000 NodeTimeRange 0.0219740867614746 MinNodeDT ( 6922) -0.00229167938232422 MaxNodeDT  ( 23513) 0.0196824073791504
Sample 1381681830.00239: NumPts 10000 NodeTimeRange 0.00434303283691406 MinNodeDT ( 6922) -0.0022892951965332 MaxNodeDT  ( 25419) 0.00205373764038086
Sample 1381681860.00239: NumPts 10000 NodeTimeRange 0.00434207916259766 MinNodeDT ( 6922) -0.0022883415222168 MaxNodeDT  ( 25419) 0.00205373764038086
Sample 1381681890.00239: NumPts 10000 NodeTimeRange 0.00434303283691406 MinNodeDT ( 6922) -0.0022885799407959 MaxNodeDT  ( 25419) 0.00205445289611816
Sample 1381681920.00239: NumPts 10000 NodeTimeRange 0.00434088706970215 MinNodeDT ( 6922) -0.00229024887084961 MaxNodeDT  ( 25419) 0.00205063819885254
Sample 1381681950.0024: NumPts 10000 NodeTimeRange 0.0218970775604248 MinNodeDT ( 6922) -0.00229310989379883 MaxNodeDT  ( 23513) 0.019603967666626
Sample 1381681980.00239: NumPts 10000 NodeTimeRange 0.00434708595275879 MinNodeDT ( 6922) -0.0022883415222168 MaxNodeDT  ( 25419) 0.00205874443054199
Sample 1381682010.00239: NumPts 10000 NodeTimeRange 0.00434398651123047 MinNodeDT ( 6922) -0.0022883415222168 MaxNodeDT  ( 25419) 0.00205564498901367
Sample 1381682040.00239: NumPts 10000 NodeTimeRange 0.00434589385986328 MinNodeDT ( 6922) -0.0022895336151123 MaxNodeDT  ( 25419) 0.00205636024475098
Sample 1381682070.00239: NumPts 10000 NodeTimeRange 0.00434494018554688 MinNodeDT ( 6922) -0.00228786468505859 MaxNodeDT  ( 25419) 0.00205707550048828
Sample interval 30 sec with 0 offset, Aggregator Interval 30 sec with 2 sec offset
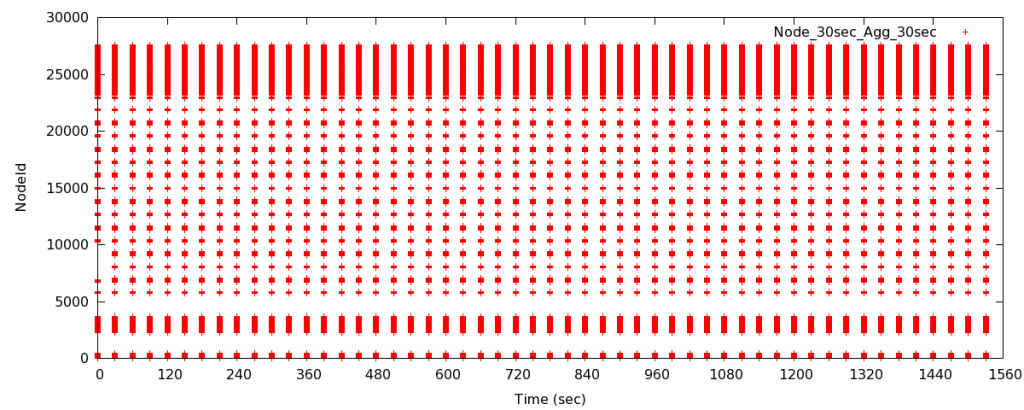
Figure 3: As in Figure 1 above the collection intervals are spaced at 30 second intervals
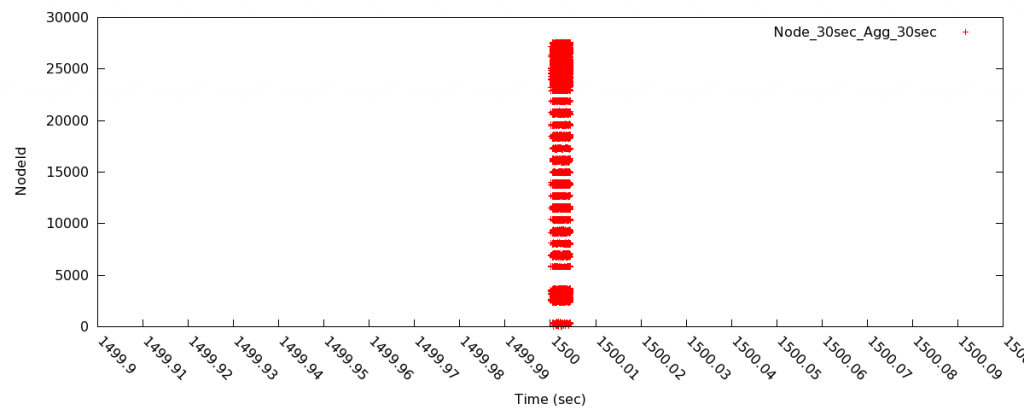
Figure 4: As in Figure2 above the collection times are tightly grouped with respect to the node’s time references
- The outliers seen above do not appear here. In fact they don’t appear in every sample of the zoomed in plot above either.
The format of the text output below is the same as that described above. The difference is the sample interval.
- This group demonstrates that we get the same results independent of sample interval assuming the aggregator interval is appropriate.
Sample 1381683210.00242: NumPts 10000 NodeTimeRange 0.00437402725219727 MinNodeDT ( 24857) -0.00230598449707031 MaxNodeDT  ( 25138) 0.00206804275512695
Sample 1381683240.00244: NumPts 10000 NodeTimeRange 0.00444388389587402 MinNodeDT ( 6922) -0.00233078002929688 MaxNodeDT  ( 24995) 0.00211310386657715
Sample 1381683270.00242: NumPts 10000 NodeTimeRange 0.0043790340423584 MinNodeDT ( 24857) -0.00230741500854492 MaxNodeDT  ( 25138) 0.00207161903381348
Sample 1381683300.00245: NumPts 10000 NodeTimeRange 0.0218169689178467 MinNodeDT ( 6922) -0.0023341178894043 MaxNodeDT  ( 23513) 0.0194828510284424
Sample 1381683330.00242: NumPts 10000 NodeTimeRange 0.0043799877166748 MinNodeDT ( 2581) -0.00230622291564941 MaxNodeDT  ( 25138) 0.00207376480102539
Sample 1381683360.00242: NumPts 10000 NodeTimeRange 0.00440120697021484 MinNodeDT ( 2581) -0.00230669975280762 MaxNodeDT  ( 24995) 0.00209450721740723
Sample 1381683390.00244: NumPts 10000 NodeTimeRange 0.00442600250244141 MinNodeDT ( 6922) -0.00232934951782227 MaxNodeDT  ( 24995) 0.00209665298461914
Sample 1381683420.00242: NumPts 10000 NodeTimeRange 0.00441098213195801 MinNodeDT ( 6922) -0.00230526924133301 MaxNodeDT  ( 24995) 0.002105712890625
Sample 1381683450.00244: NumPts 10000 NodeTimeRange 0.0217878818511963 MinNodeDT ( 6922) -0.00233221054077148 MaxNodeDT  ( 23513) 0.0194556713104248
Sample 1381683480.00242: NumPts 10000 NodeTimeRange 0.00440716743469238 MinNodeDT ( 6922) -0.00230550765991211 MaxNodeDT  ( 24995) 0.00210165977478027
Sample 1381683510.00242: NumPts 10000 NodeTimeRange 0.00437498092651367 MinNodeDT ( 6922) -0.00230503082275391 MaxNodeDT  ( 25138) 0.00206995010375977
Sample 1381683540.00244: NumPts 10000 NodeTimeRange 0.00444293022155762 MinNodeDT ( 6922) -0.00232887268066406 MaxNodeDT  ( 24995) 0.00211405754089355
Sample 1381683570.00242: NumPts 10000 NodeTimeRange 0.00438499450683594 MinNodeDT ( 3481) -0.00230526924133301 MaxNodeDT  ( 20613) 0.00207972526550293
Sample 1381683600.00244: NumPts 10000 NodeTimeRange 0.0217537879943848 MinNodeDT ( 6922) -0.00233221054077148 MaxNodeDT  ( 23513) 0.0194215774536133
Sample 1381683630.00242: NumPts 10000 NodeTimeRange 0.00438904762268066 MinNodeDT ( 2581) -0.00230503082275391 MaxNodeDT  ( 25138) 0.00208401679992676
Sample 1381683660.00242: NumPts 10000 NodeTimeRange 0.0043938159942627 MinNodeDT ( 2581) -0.00230574607849121 MaxNodeDT  ( 24995) 0.00208806991577148
Sample 1381683690.00244: NumPts 10000 NodeTimeRange 0.00441193580627441 MinNodeDT ( 6922) -0.00232934951782227 MaxNodeDT  ( 24995) 0.00208258628845215
Sample 1381683720.00242: NumPts 10000 NodeTimeRange 0.00440692901611328 MinNodeDT ( 6922) -0.00230503082275391 MaxNodeDT  ( 24995) 0.00210189819335938
Sample 1381683750.00244: NumPts 10000 NodeTimeRange 0.0218968391418457 MinNodeDT ( 6922) -0.00233149528503418 MaxNodeDT  ( 23513) 0.0195653438568115
Sample 1381683780.00242: NumPts 10000 NodeTimeRange 0.00439786911010742 MinNodeDT ( 2581) -0.00230550765991211 MaxNodeDT  ( 24995) 0.00209236145019531
Sample 1381683810.00242: NumPts 10000 NodeTimeRange 0.0043799877166748 MinNodeDT ( 3203) -0.0023047924041748 MaxNodeDT  ( 25138) 0.0020751953125
Sample 1381683840.00244: NumPts 10000 NodeTimeRange 0.00452899932861328 MinNodeDT ( 6922) -0.00232911109924316 MaxNodeDT  ( 27497) 0.00219988822937012
Sample 1381683870.00242: NumPts 10000 NodeTimeRange 0.00439000129699707 MinNodeDT ( 6922) -0.00230598449707031 MaxNodeDT  ( 25138) 0.00208401679992676
Sample 1381683900.00244: NumPts 10000 NodeTimeRange 0.0219759941101074 MinNodeDT ( 6922) -0.00233197212219238 MaxNodeDT  ( 23513) 0.019644021987915
Sample 1381683930.00242: NumPts 10000 NodeTimeRange 0.00438785552978516 MinNodeDT ( 3203) -0.0023045539855957 MaxNodeDT  ( 25138) 0.00208330154418945
Sample 1381683960.00242: NumPts 10000 NodeTimeRange 0.00439000129699707 MinNodeDT ( 2581) -0.00230526924133301 MaxNodeDT  ( 25138) 0.00208473205566406
Sample 1381683990.00244: NumPts 10000 NodeTimeRange 0.00440788269042969 MinNodeDT ( 6922) -0.00232696533203125 MaxNodeDT  ( 24995) 0.00208091735839844
Sample 1381684020.00242: NumPts 10000 NodeTimeRange 0.00439691543579102 MinNodeDT ( 6922) -0.00230646133422852 MaxNodeDT  ( 25138) 0.0020904541015625
Sample 1381684050.00244: NumPts 10000 NodeTimeRange 0.021946907043457 MinNodeDT ( 6922) -0.00233221054077148 MaxNodeDT  ( 23513) 0.0196146965026855
Sample 1381684080.00242: NumPts 10000 NodeTimeRange 0.00648617744445801 MinNodeDT ( 2378) -0.00230717658996582 MaxNodeDT  ( 25645) 0.00417900085449219
Sample 1381684110.00241: NumPts 10000 NodeTimeRange 0.00438785552978516 MinNodeDT ( 2581) -0.0023033618927002 MaxNodeDT  ( 25138) 0.00208449363708496
Sample 1381684140.00244: NumPts 10000 NodeTimeRange 0.00441479682922363 MinNodeDT ( 6922) -0.00232839584350586 MaxNodeDT  ( 24995) 0.00208640098571777
Sample 1381684170.00242: NumPts 10000 NodeTimeRange 0.0043950080871582 MinNodeDT ( 2581) -0.00230717658996582 MaxNodeDT  ( 25138) 0.00208783149719238
Sample 1381684200.00244: NumPts 10000 NodeTimeRange 0.0226118564605713 MinNodeDT ( 6922) -0.00233197212219238 MaxNodeDT  ( 23513) 0.0202798843383789
Sample 1381684230.00242: NumPts 10000 NodeTimeRange 0.0043950080871582 MinNodeDT ( 2581) -0.00230550765991211 MaxNodeDT  ( 25138) 0.00208950042724609
Sample 1381684260.00242: NumPts 10000 NodeTimeRange 0.00438404083251953 MinNodeDT ( 3203) -0.00230622291564941 MaxNodeDT  ( 25138) 0.00207781791687012
Sample 1381684290.00244: NumPts 10000 NodeTimeRange 0.00442099571228027 MinNodeDT ( 6922) -0.00232863426208496 MaxNodeDT  ( 24995) 0.00209236145019531
Sample 1381684320.00242: NumPts 10000 NodeTimeRange 0.00439190864562988 MinNodeDT ( 6922) -0.00230598449707031 MaxNodeDT  ( 25138) 0.00208592414855957
Sample 1381684350.00244: NumPts 10000 NodeTimeRange 0.0229129791259766 MinNodeDT ( 6922) -0.00233292579650879 MaxNodeDT  ( 23513) 0.0205800533294678
Sample 1381684380.00242: NumPts 10000 NodeTimeRange 0.00438404083251953 MinNodeDT ( 6922) -0.00230646133422852 MaxNodeDT  ( 24995) 0.00207757949829102
Sample 1381684410.00242: NumPts 10000 NodeTimeRange 0.00438499450683594 MinNodeDT ( 2581) -0.0023040771484375 MaxNodeDT  ( 24995) 0.00208091735839844
Sample 1381684440.00244: NumPts 10000 NodeTimeRange 0.00443100929260254 MinNodeDT ( 6922) -0.00232863426208496 MaxNodeDT  ( 27497) 0.00210237503051758
Sample 1381684470.00242: NumPts 10000 NodeTimeRange 0.0043938159942627 MinNodeDT ( 2581) -0.00230526924133301 MaxNodeDT  ( 24995) 0.00208854675292969
Sample 1381684500.00244: NumPts 10000 NodeTimeRange 0.0107631683349609 MinNodeDT ( 6922) -0.00233340263366699 MaxNodeDT  ( 27595) 0.00842976570129395
Sample 1381684530.00242: NumPts 10000 NodeTimeRange 0.00438499450683594 MinNodeDT ( 2581) -0.0023040771484375 MaxNodeDT  ( 24995) 0.00208091735839844
Sample 1381684560.00242: NumPts 10000 NodeTimeRange 0.00437116622924805 MinNodeDT ( 3203) -0.00230669975280762 MaxNodeDT  ( 24995) 0.00206446647644043
Sample 1381684590.00244: NumPts 10000 NodeTimeRange 0.00442790985107422 MinNodeDT ( 6922) -0.00232839584350586 MaxNodeDT  ( 24995) 0.00209951400756836
Sample 1381684620.00242: NumPts 10000 NodeTimeRange 0.00444412231445312 MinNodeDT ( 3203) -0.00230622291564941 MaxNodeDT  ( 27497) 0.00213789939880371
Sample 1381684650.00244: NumPts 10000 NodeTimeRange 0.0220239162445068 MinNodeDT ( 6922) -0.00233173370361328 MaxNodeDT  ( 23513) 0.0196921825408936
Sample 1381684680.00242: NumPts 10000 NodeTimeRange 0.00439095497131348 MinNodeDT ( 6922) -0.00230598449707031 MaxNodeDT  ( 27497) 0.00208497047424316
Nodes with Apps
In order to evaluate the effect of an application on the node to the synchronization of collection, we ran with the following conditions: Nodes originally only with LDMS (1 sec sample, 1 sec agg). Then application run. Then back to only LDMS.
- PSNAP – 100 microsec loops
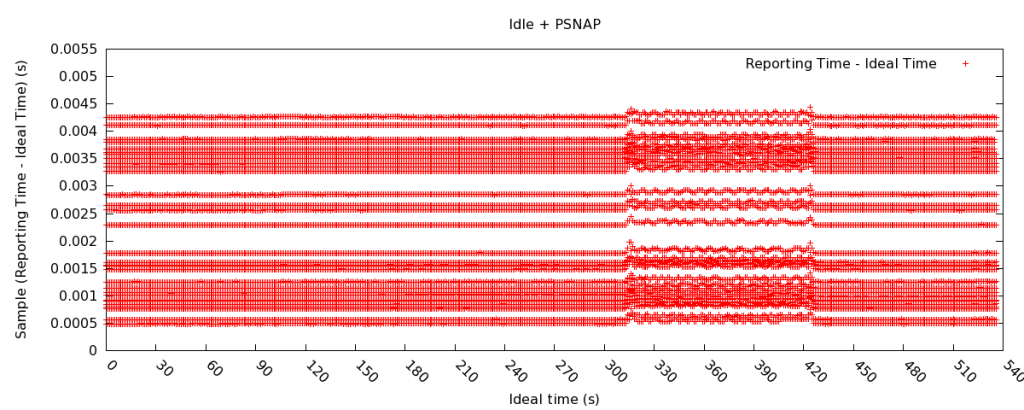
- Minighost
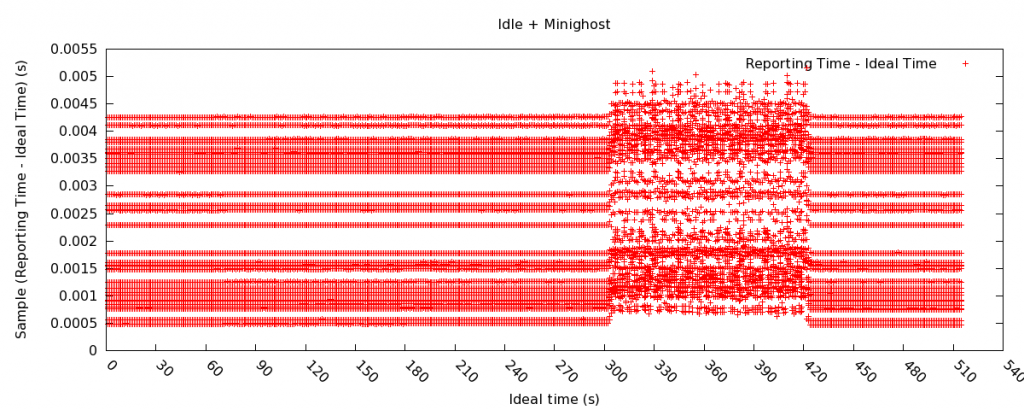
From Figures above application on the nodes shifts the reported collection time by <100usec for PSNAP and <1ms for Minighost.
Description of Metrics in the Cray_system_sampler
NOTE: more info on the Gemini Metric Performance Counters can be found in CrayDoc S-0025-10.pdf. Calculations for the non-dervied Gemini and NIC-related metrics can be found in the gpcdr configuration file.
- nettopo_mesh_coord_X/Y/Z – Gemini mesh coords of the node
- X/Y/Z+/-_traffic (B) – Link aggregated Gemini traffic counter in Bytes
- X/Y/Z+/-_packets (1) – Link aggregated Gemini packet counter
- X/Y/Z+/-_inq_stall (ns) – Link aggregated Gemini input stalls
- X/Y/Z+/-_credit_stall (ns) – Link aggregated Gemini output stalls
- X/Y/Z+/-_sendlinkstatus (1) – link aggregated status information (used to detect degraded links)
- X/Y/Z+/-_recvlinkstatus (1) – link aggregated status information (used to detect degraded links)
- X/Y/Z+/-_SAMPLE_GEMINI_LINK_BW (B/s) – Derived metric of link aggregated bandwidth based on the current and previous sample
- X/Y/Z+/-_SAMPLE_GEMINI_LINK_USED_BW (% x10e6) – Derived metrics of link aggregated bandwidth based on the current and previous sample and the estimated max BW for this link
- X/Y/Z+/-_SAMPLE_GEMINI_LINK_PACKETSIZE_AVE (B) – Derived metrics of link aggregated ave packetsize based on the current and previous sample
- X/Y/Z+/-_SAMPLE_GEMINI_LINK_INQ_STALL (% x10e6) – Derived metrics of link aggregated percent input stalls based on the current and previous sample
- X/Y/Z+/-_SAMPLE_GEMINI_LINK_CREDIT_STALL (% x10e6) – Derived metrics of link aggregated percent output stalls based on the current and previous sample
From Cray Re OptA vs OptB:
The fundamental issue is that some of the performance counters count data that doesn’t actually make it onto the HSN. There are overhead flits counted as parts of some Get transaction, and demarcation packets within some transactions that are entirely generated by and consumed by the local Gemini. There isn’t enough information available to compensate exactly for them.
Option A takes a simplistic approach, and ignores the issue. The extra bytes are counted as if they’re message payload.
Option B is preferred. It makes two assumption we believe are reasonable:
- Packets part of BTE Puts will mostly be max-sized.
- The majority of Get requests will be BTE, not FMA.
We believe this matches MPI’s use.
The BTE is used for large transfers. Only the first and last packets of a transfer may be less than max sized. As the transfers are large, most of the packets will not be the first or last packet.
Option A may be more accurate if actual use doesn’t match these assumptions.
- totaloutput_optA
- totalinput
- fmaout
- bteout_optA
- bteout_optB
- totaloutput_optB
- SAMPLE_totaloutput_optA (B/s) – Derived metric based on the current and previous sample
- SAMPLE_totalinput (B/s) – Derived metric based on the current and previous sample
- SAMPLE_fmaout (B/s) – Derived metric based on the current and previous sample
- SAMPLE_bteout_optA (B/s) – Derived metric based on the current and previous sample
- SAMPLE_bteout_optB (B/s) – Derived metric based on the current and previous sample
- SAMPLE_totaloutput_optB (B/s) – Derived metric based on the current and previous sample
- lustrefs.stats.dirty_pages_hits
- lustrefs.stats.dirty_pages_misses
- lustrefs.stats.writeback_from_writepage
- lustrefs.stats.writeback_from_pressure
- lustrefs.stats.writeback_ok_pages
- lustrefs.stats.writeback_failed_pages
- lustrefs.stats.read_bytes
- lustrefs.stats.write_bytes
- lustrefs.stats.brw_read
- lustrefs.stats.brw_write
- lustrefs.stats.ioctl
- lustrefs.stats.open
- lustrefs.stats.close
- lustrefs.stats.mmap
- lustrefs.stats.seek
- lustrefs.stats.fsync
- lustrefs.stats.setattr
- lustrefs.stats.truncate
- lustrefs.stats.lockless_truncate
- lustrefs.stats.flock
- lustrefs.stats.getattr
- lustrefs.stats.statfs
- lustrefs.stats.alloc_inode
- lustrefs.stats.setxattr
- lustrefs.stats.getxattr
- lustrefs.stats.listxattr
- lustrefs.stats.removexattr
- lustrefs.stats.inode_permission
- lustrefs.stats.direct_read
- lustrefs.stats.direct_write
- lustrefs.stats.lockless_read_bytes
- lustrefs.stats.lockless_write_bytes
- nr_dirty
- nr_writeback
- loadavg_latest(x100)
- loadavg_5min(x100)
- loadavg_running_processes
- loadavg_total_processes
- current_freemem
- ipogif0_rx_bytes
- ipogif0_tx_bytes
- SMSG_ntx
- SMSG_tx_bytes
- SMSG_nrx
- SMSG_rx_bytes
- RDMA_ntx
- RDMA_tx_bytes
- RDMA_nrx
- RDMA_rx_bytes